Setting the Standard in Gamification for iGaming
We’ve spent years perfecting an iGaming gamification software ecosystem shaped by the needs of hundreds of global clients. Backed by seasoned CRM professionals, Smartico offers tools designed for player retention and user engagement without gimmicks or shortcuts.


.avif)


.svg)

The first unified CRM and Gamification platform
Smartico was the first to unify iGaming CRM and Gamification into a single solution. While others follow, we continue to set the benchmark.

One Source of Truth

Behavior-Based Triggers

All-in-One Control
Gamification Done Right
We give you complete control over every gamification element to match your goals.
With Smartico, gamification isn’t a gimmick; it’s how you increase revenue, cut bonus costs, and keep players coming back.
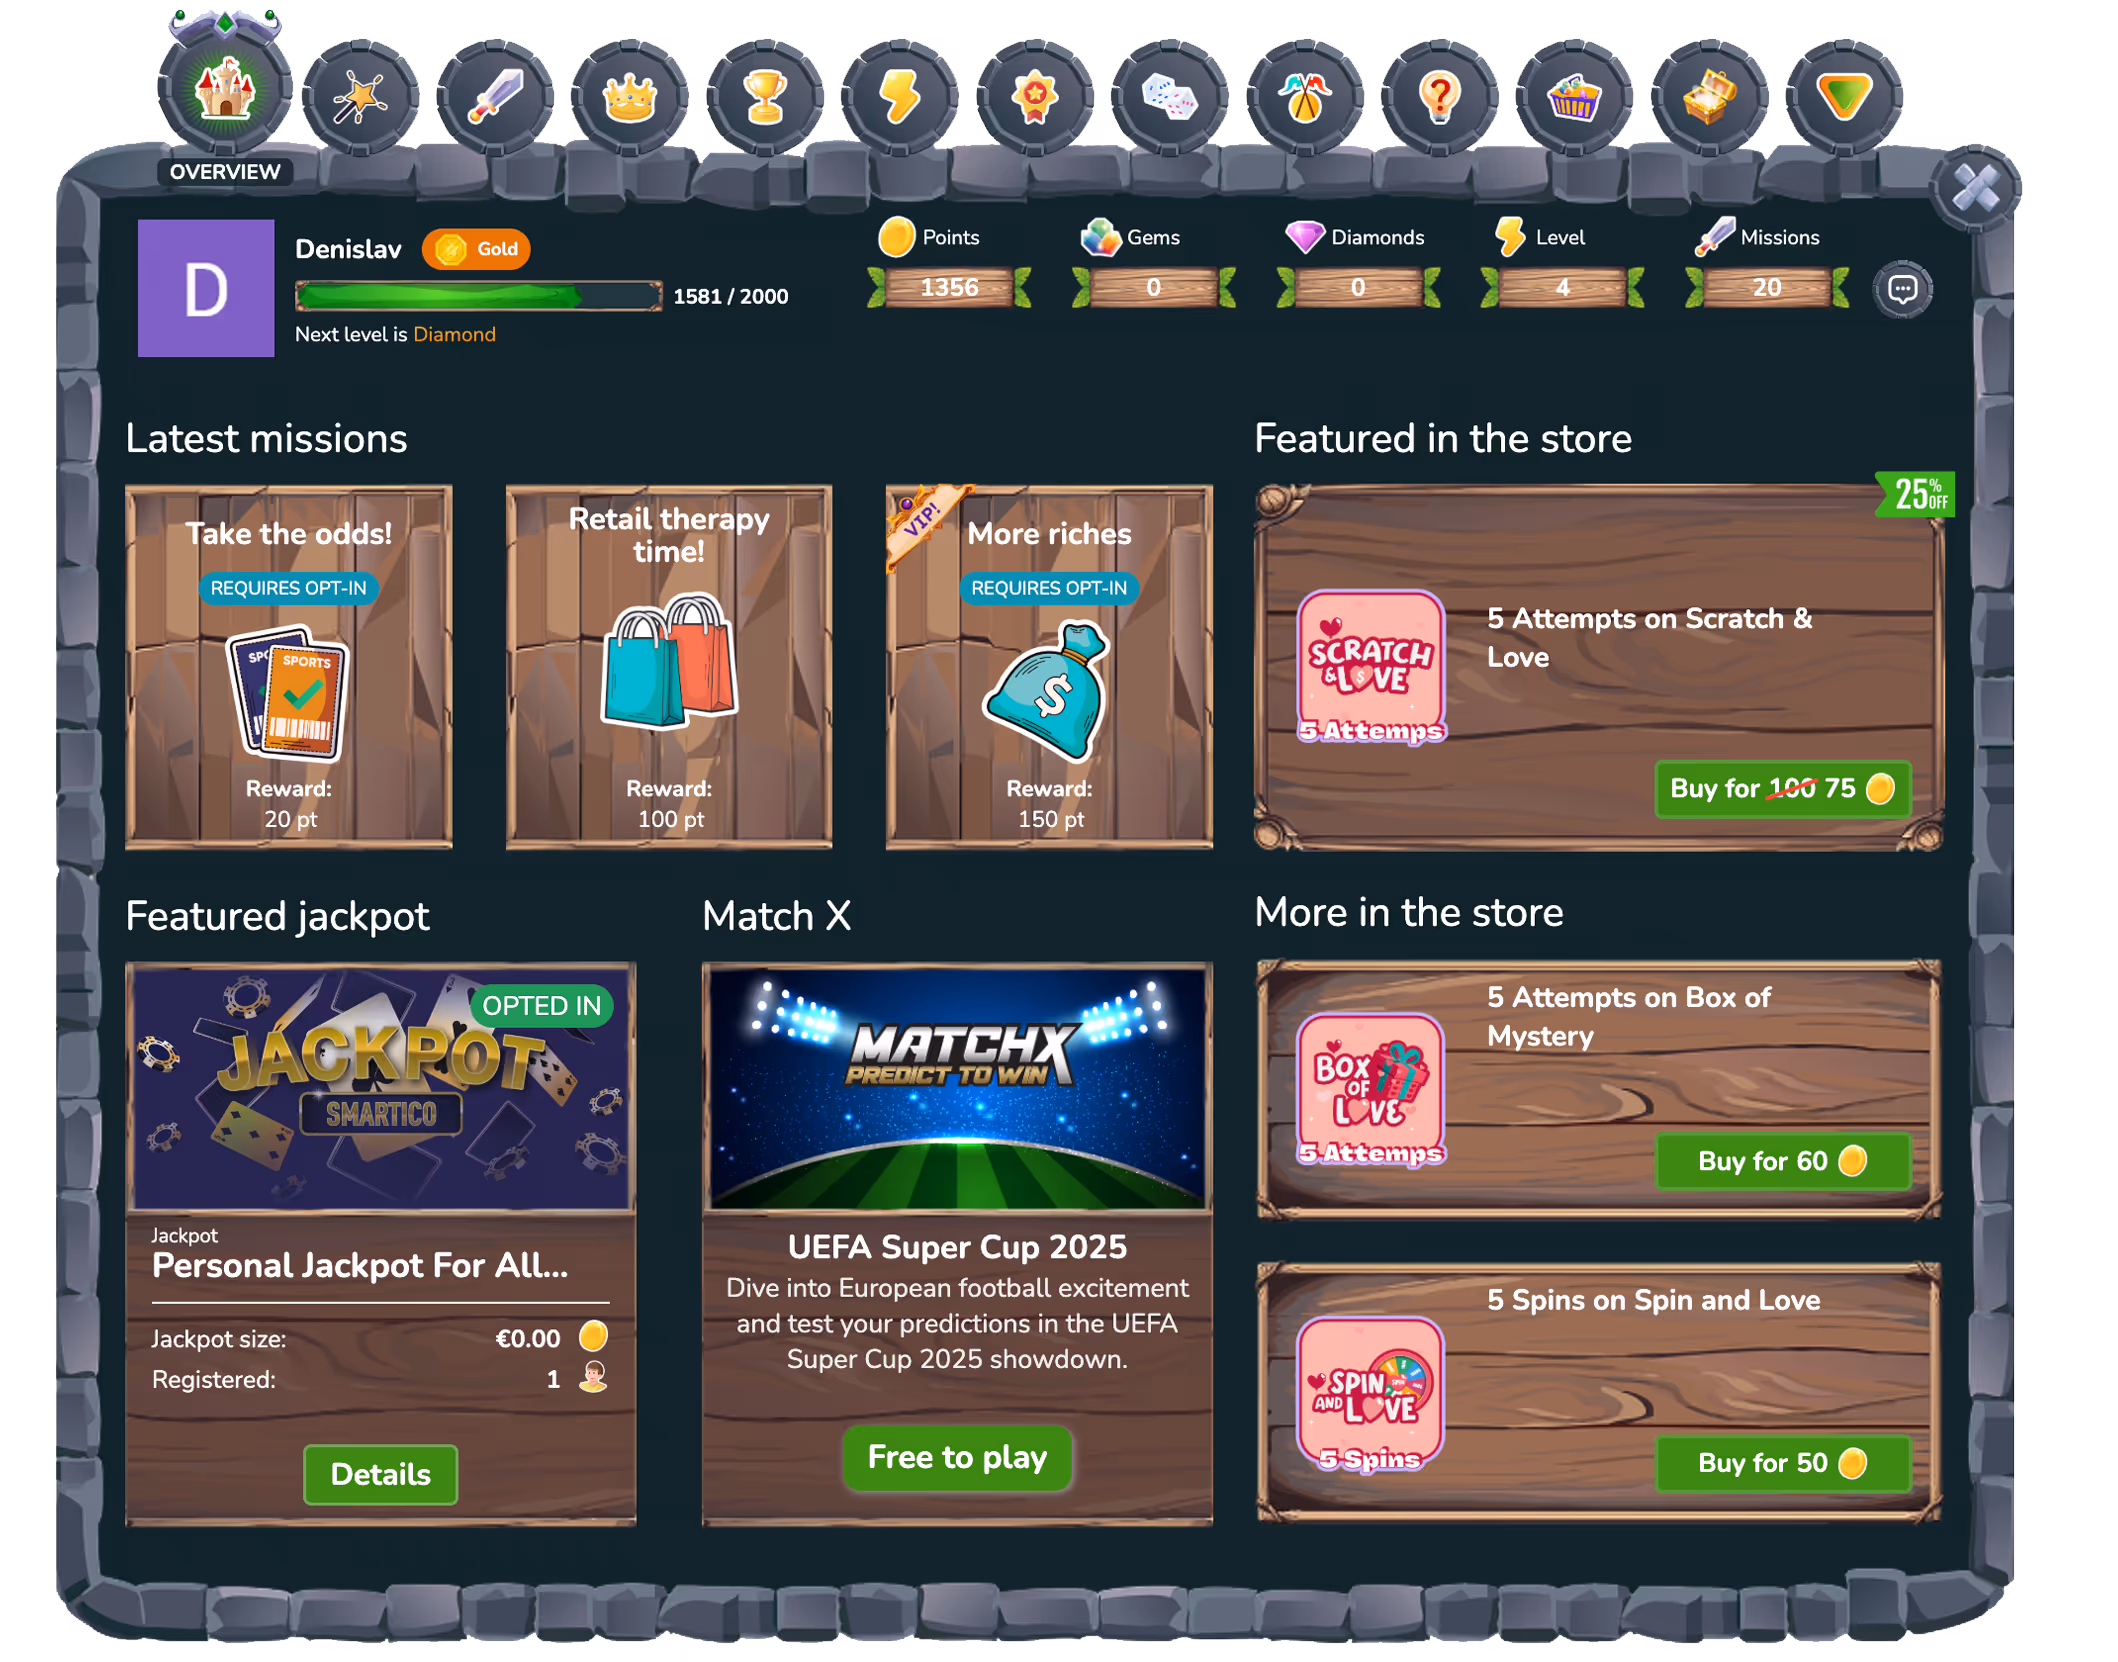
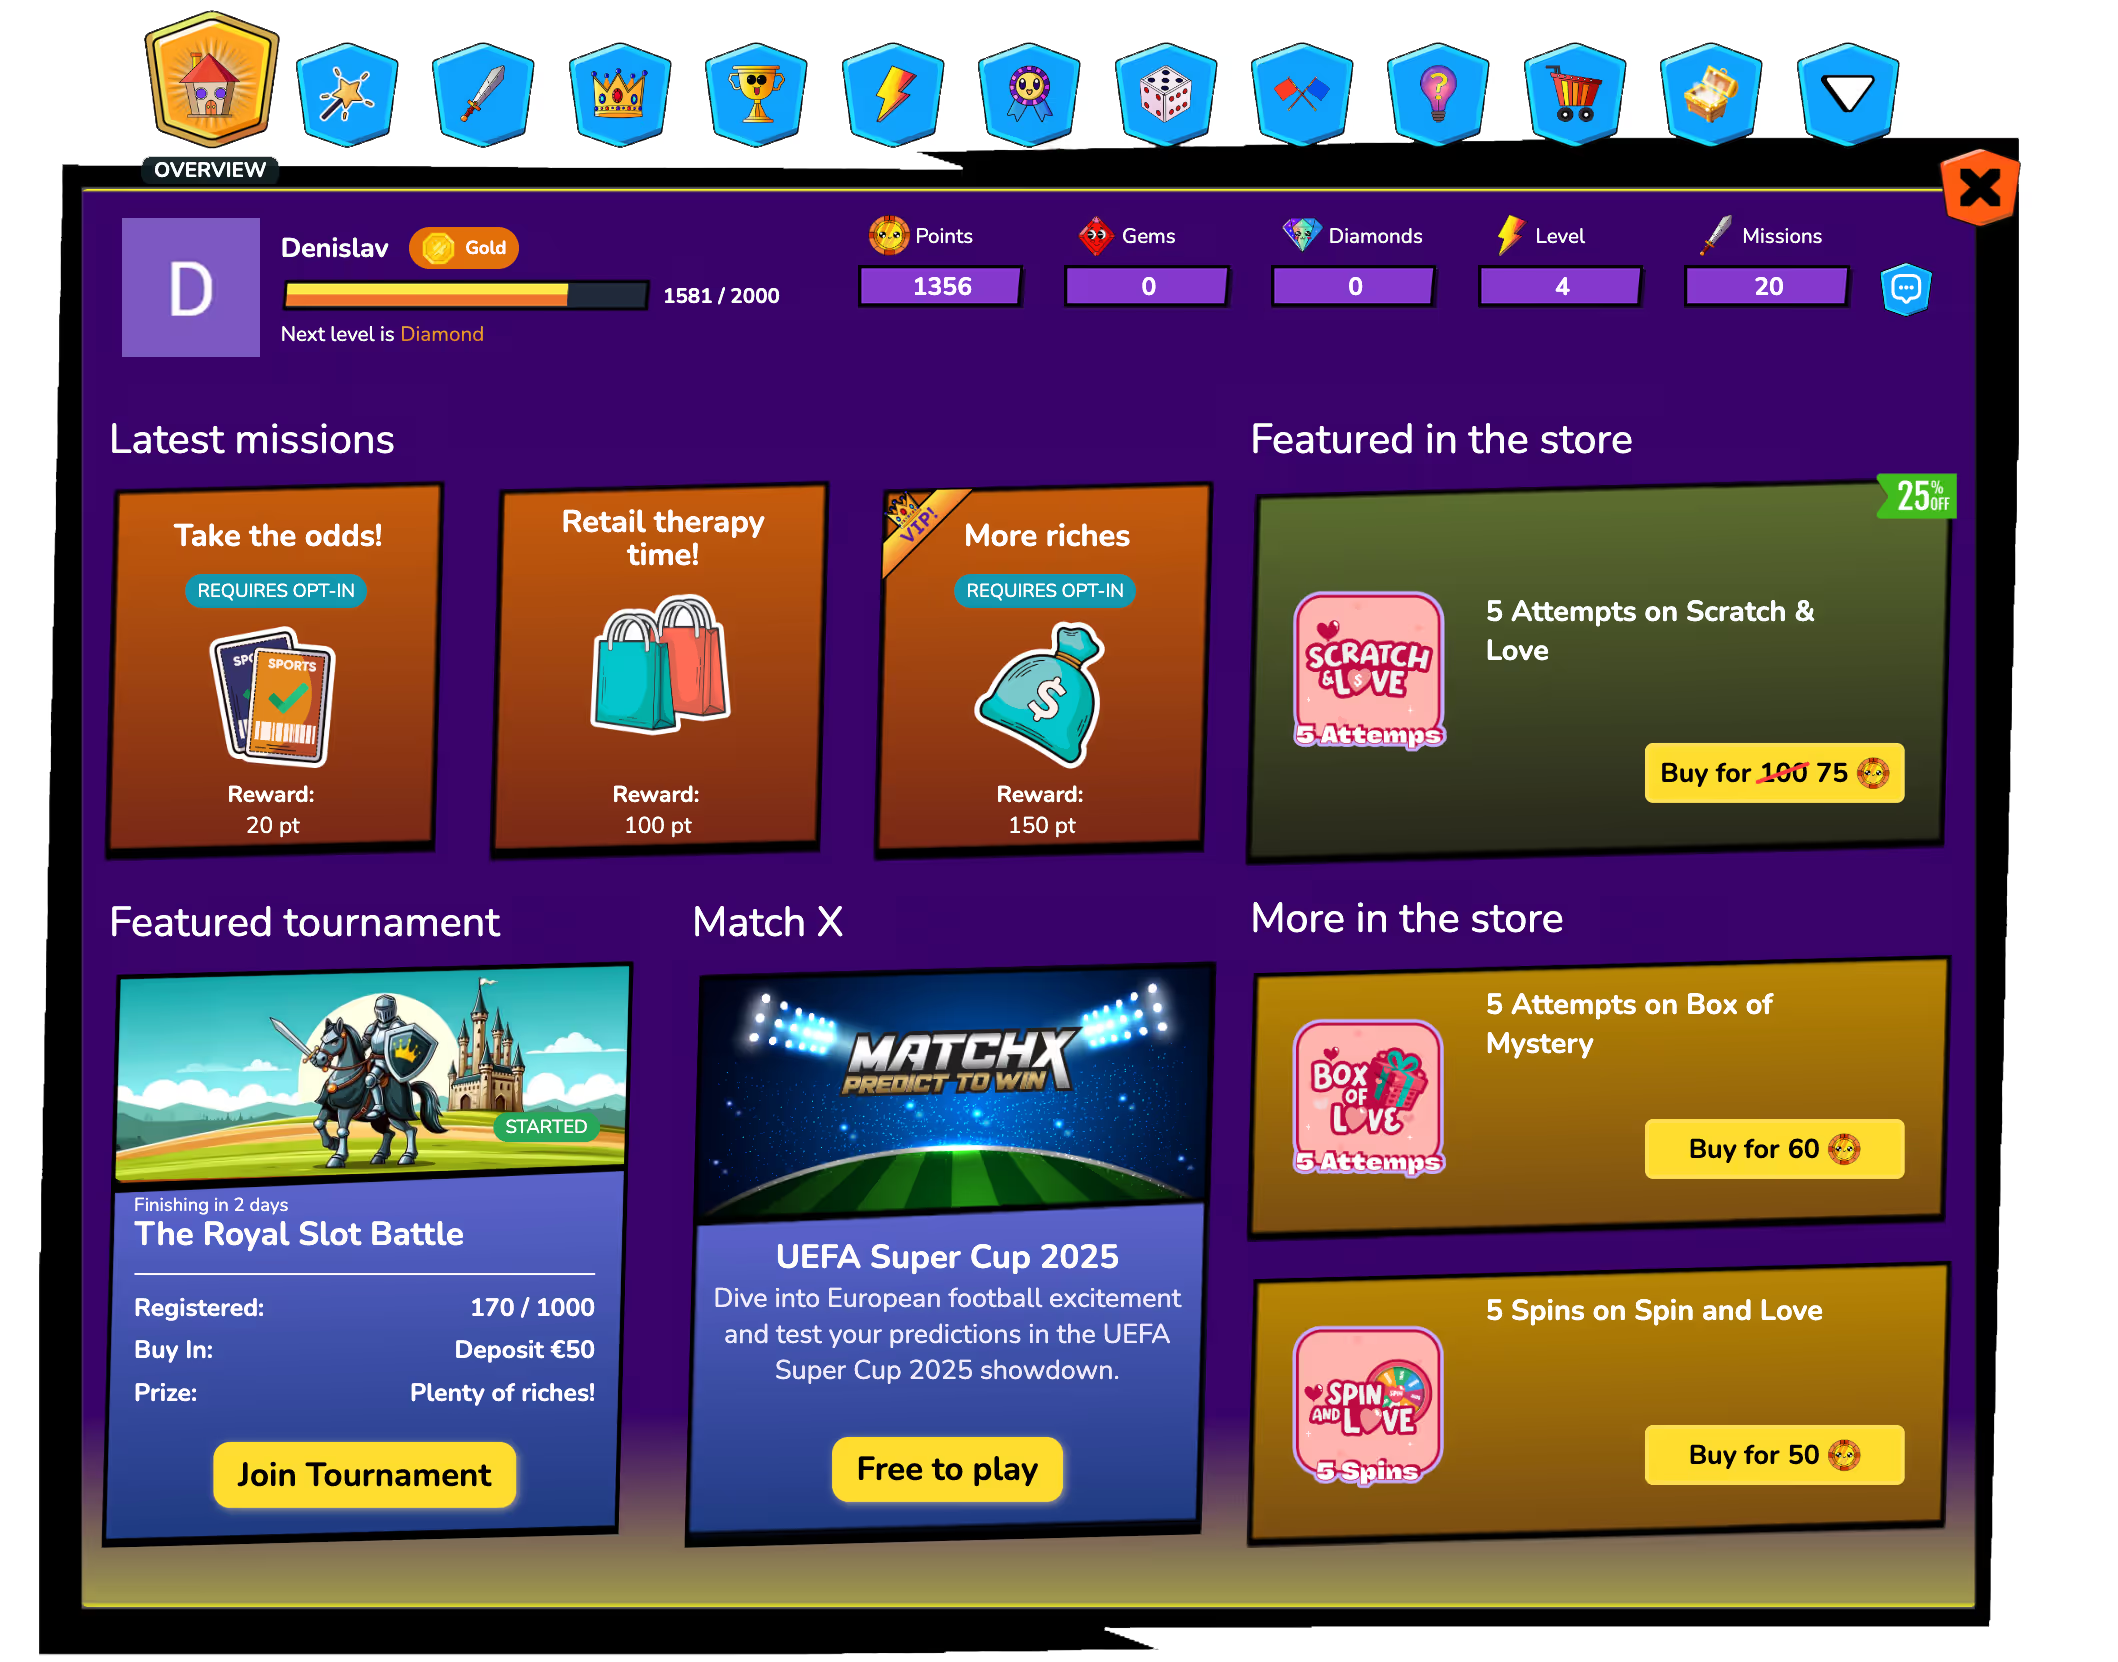
Create tailored missons for your players
- Design personalized missions that encourage specific player behaviors, such as completing spins or trying new games.
- Reward players with points, free spins, or bonuses to enhance engagement and retention.

Motivate progression with level-based rewards
- Players unlock exclusive rewards as they advance through levels, encouraging consistent play.
- Provide a sense of progression that keeps players engaged and striving for more.

Add Competition with real-time leaderboards
- Highlight top players in daily, weekly, or monthly leaderboards to drive activity.
- Motivate players to climb the ranks by offering meaningful rewards for top performers.

Excite players with competitive tournaments
- Organize time-limited tournaments for any activity: casino games, sports bets, or custom challenges.
- Customize events to engage specific players or align with promotions.

Recognize achievements with collectible badges
- Award badges for reaching milestones, completing missions, or performing key actions.
- Encourage players to collect and showcase achievements, adding depth to their experience.

Turn points into rewards at the marketplace
- Provide players with a shop to redeem points for bonuses, free spins, cashback, or exclusive items.
- Enjoy full flexibility with customizable categories, multicurrency support, and safeguards like purchase limits and terms to maintain engagement.

Points: The Core of Engagement
- Customizable Currency: Define the name, value, and purpose of your points to match your brand and strategy.
- Flexible Redemption: Allow players to use points for bonuses, free spins, or exclusive items in your marketplace.

Customize it your way


Add Competition with real-time leaderboards
- Highlight top players in daily, weekly, or monthly leaderboards to drive activity.
- Motivate players to climb the ranks by offering meaningful rewards for top performers.
Customize your way


Easy Plug-and-Play Widgets

Customizable Retention APIs

Open-Source Examples
Beyond Technology:
We Bring Expertise and Partnership
With Smartico, you’re not just getting gamification software - you’re gaining a partner invested in your growth. We work alongside you to build CRM expertise within your team, guiding strategy, and offering practical, hands-on insights throughout our partnership. It's the ultimate Gamification & CRM marketing solutions system tailored to your iGaming business.

1. Tailored Onboarding and Training
Our team ensures a smooth, personalized setup from day one, with training that empowers you every step of the way

2. Dedicated Success Managers
A true partner in your growth, guiding you to unlock the full potential of Smartico throughout our entire partnership.

3. Reliable, Expert Support
Our expert help is a message away, ensuring you have the insights and solutions you need to keep moving forward.
What clients have to say


FAQ
FAQ
Ready to use Smartico?
Join hundreds of businesses worldwide engaging players with Smartico.